Research Overview
Background
The human body consists of approximately 40 trillion cells, and each cell
houses totally about 2 meters of human genome DNA. Negatively charged DNA
is wrapped around positively charged histones to form nucleosomes (Fig.
1, left). Chromatin refers to nucleosomes associated with other proteins
and RNAs. How can such a long nucleosome chain be packed into a tiny cell,
and how does it behave in living cells? Even 70 years after the discovery
of the DNA double helix structure, this remains a fundamental question
in biology.
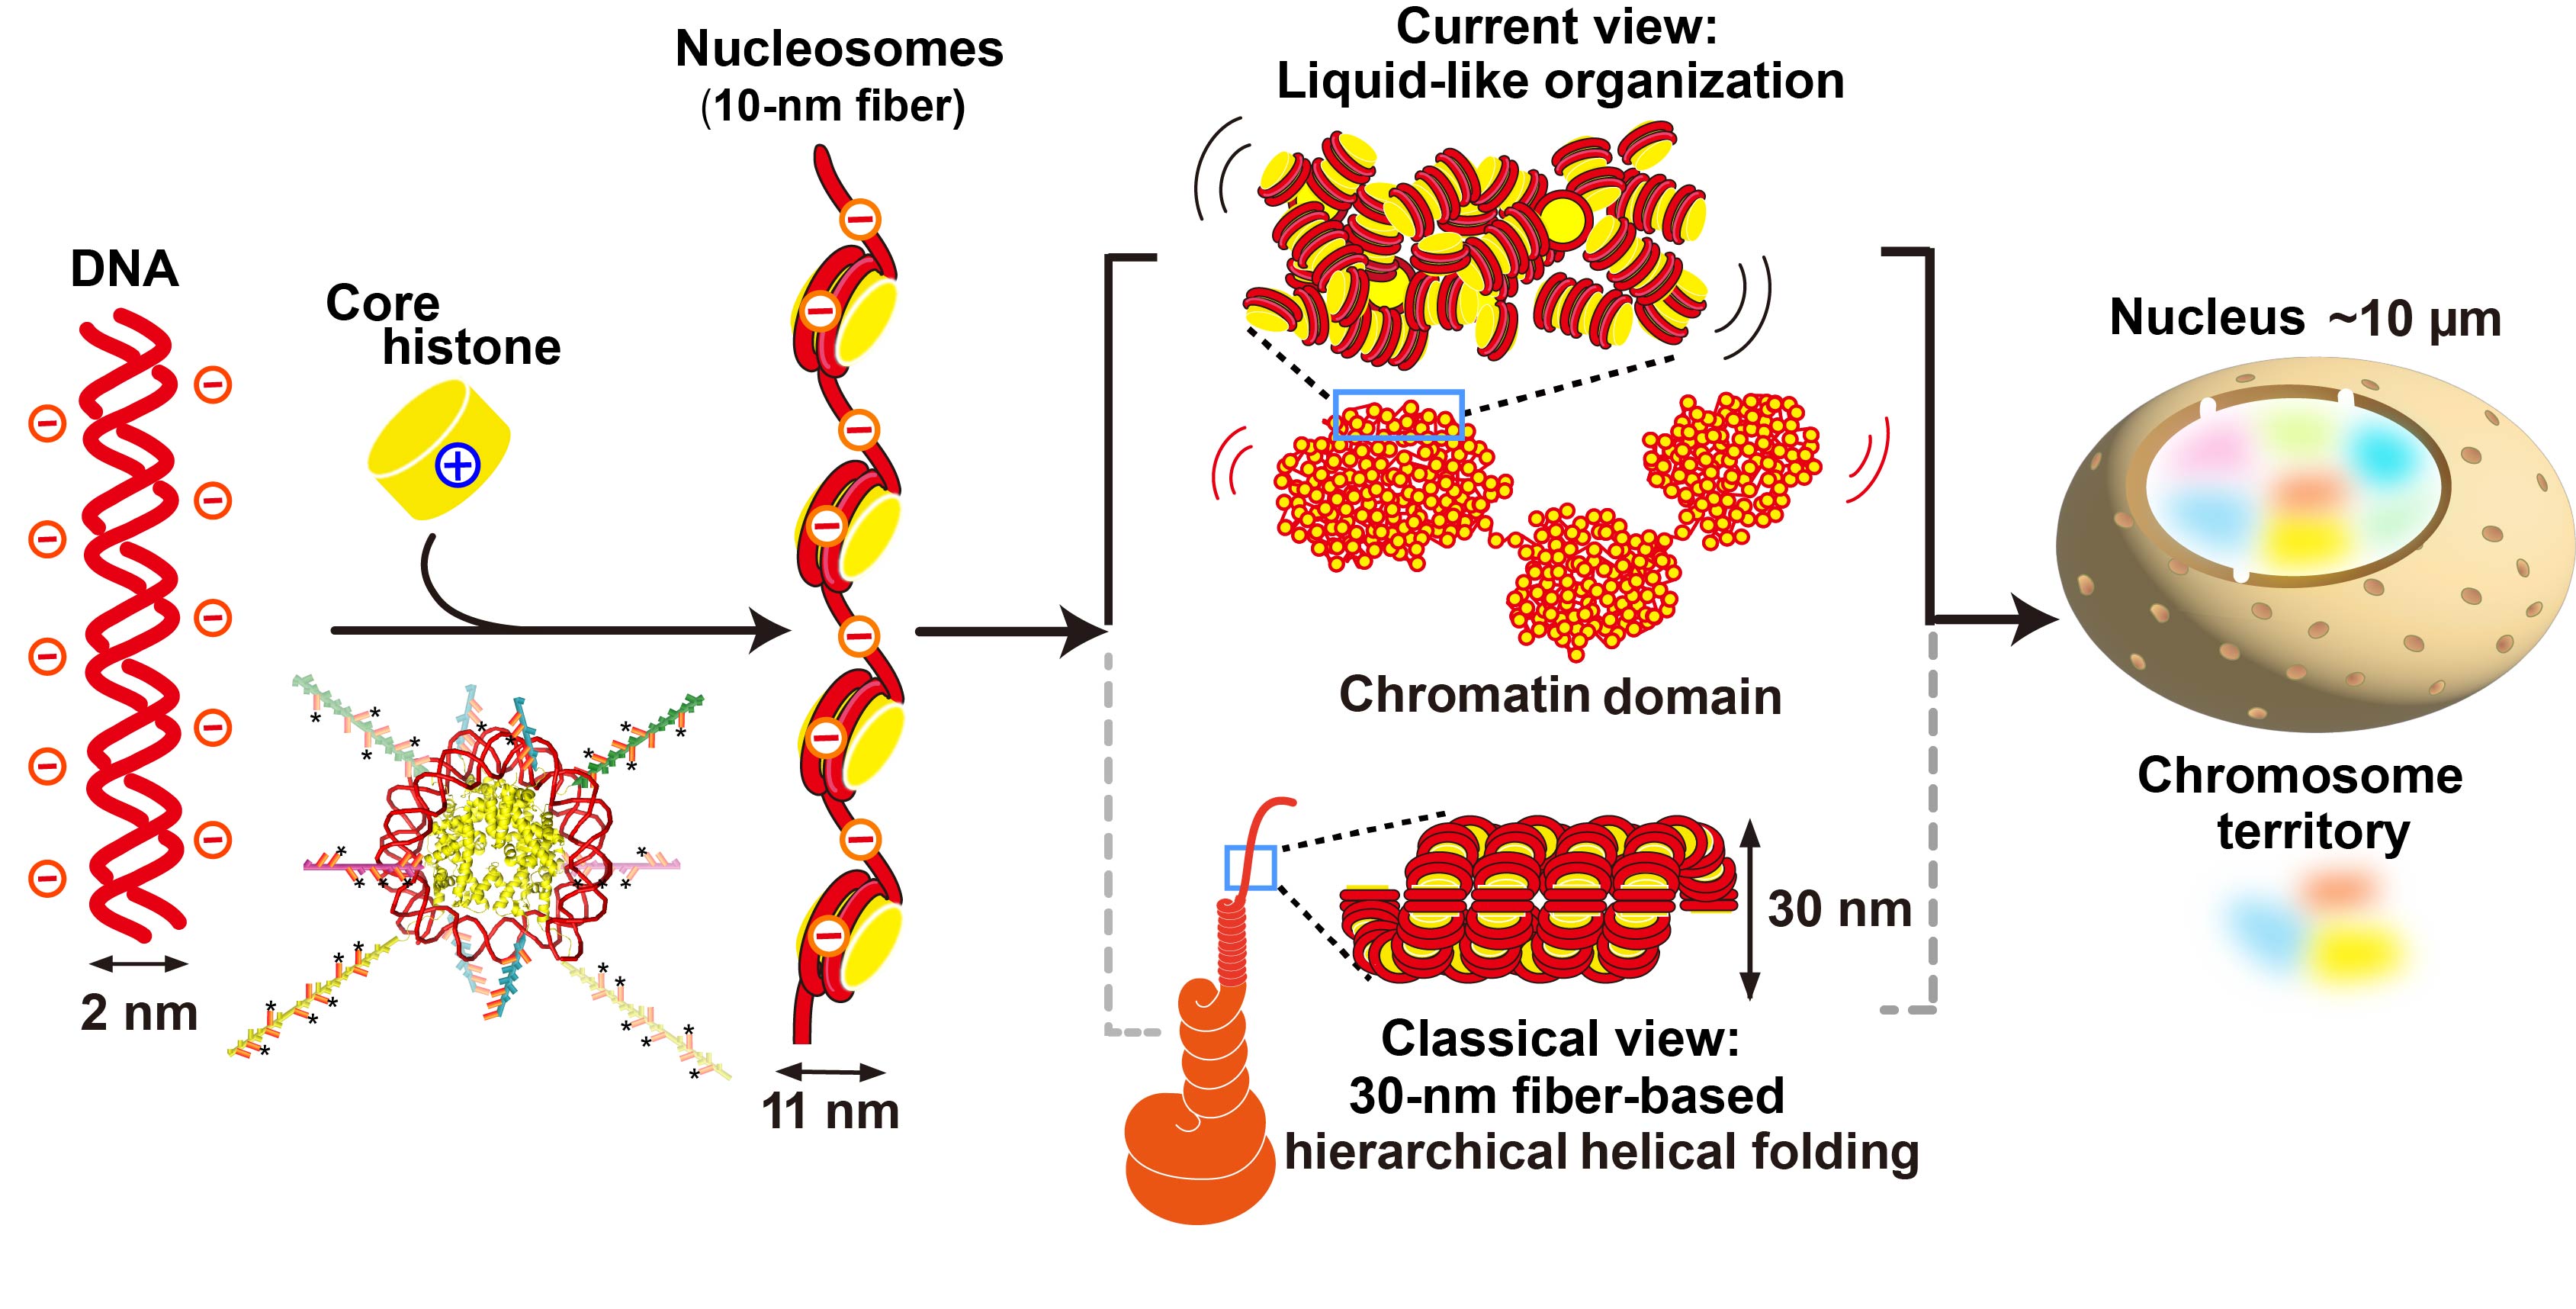
Figure 1.Schematic of DNA, nucleosomes, and chromatin domains. The emerging model of chromatin organization in living cells is shown in the upper panel, whereas the classical model is shown in the lower panel. Reproduced from Maeshima, PJASB 2025.
In the classical textbook model, nucleosomes were thought to fold into
regular 30-nm chromatin fibers and then into progressively thicker fiber
structures through hierarchical helical folding (Fig. 1, lower middle).
If this were the case, proteins would need to repeatedly unwind multiple
layers of higher-order structures to access specific DNA regions. Does
such a process really occur in living cells?
For more than two decades, we have tackled this question. We showed that
strings of nucleosomes in living human cells do not form regular, periodic
hierarchical structures including the 30-nm fiber, but instead fold irregularly
(Fig. 1, upper middle)(Maeshima et al., Curr Opin Cell Biol 2019). Based on this irregular folding, we hypothesized that nucleosomes
are not strongly constrained and that chromatin can be physically dynamic.
Indeed, by tracking individual nucleosomes in living cells using single-molecule
microscopy, we found that nucleosomes fluctuate dynamically in place and
exhibit liquid-like behavior on short time scales (Fig. 2, left; movie)(Iida
et al., Science Adv 2022; Nozaki et al., Science Adv 2023). Furthermore, super-resolution microscopy revealed that nucleosomes
form ~200-nm condensed chromatin domains (Fig. 2, right)(Nozaki et al.,
Mol Cell 2017; Nozaki et al., Science Adv2023; Iida, Shimazoe et al. bioRxiv2025).
Many genome processes, including DNA replication and transcription, are
thought to proceed with chromatin domains as functional units. We have
also shown that nucleosome fluctuations facilitate protein access to DNA
within chromatin domains (Hihara et al., Cell Rep 2012).
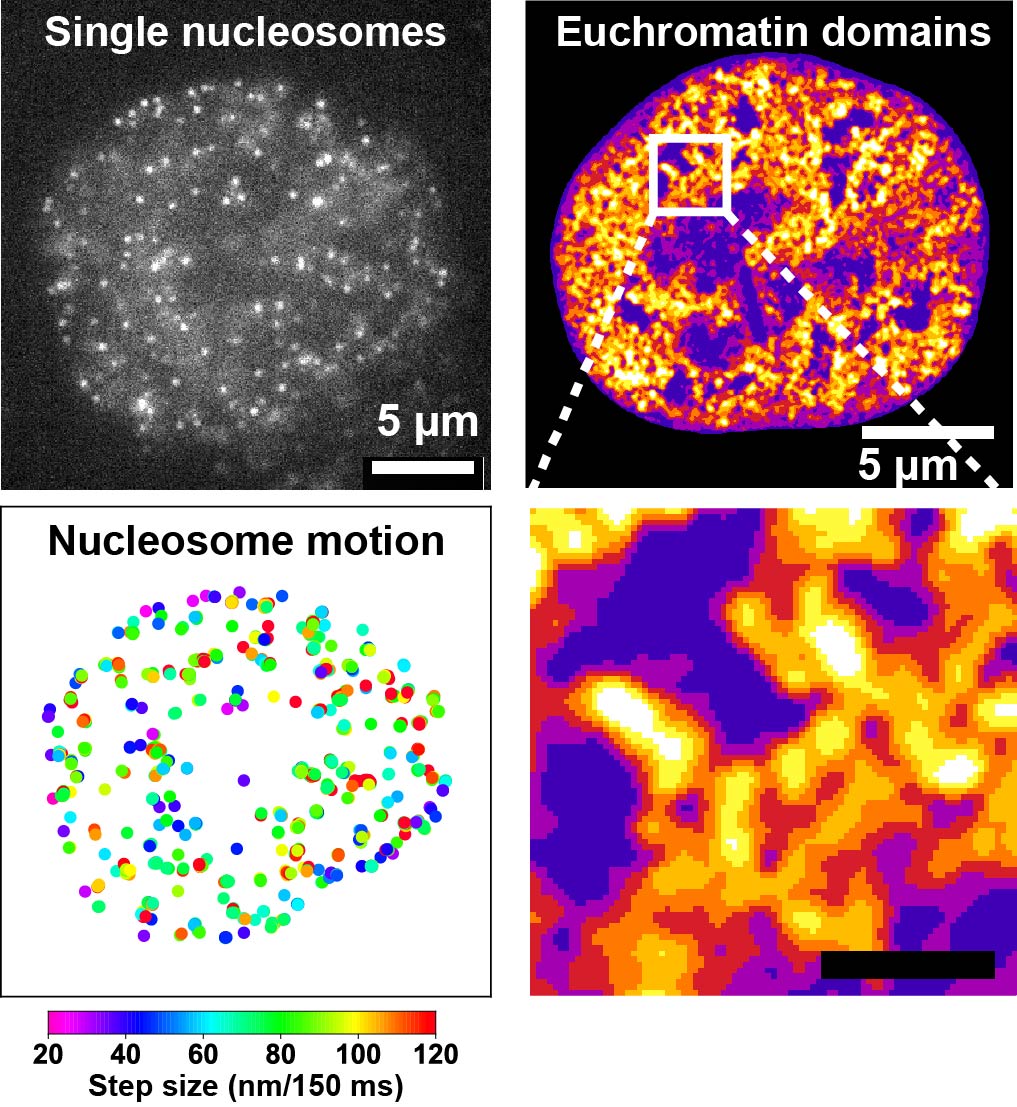
Figure 2.Left: Each dot represents a single nucleosome. By precisely localizing the center of each dot, nucleosome motion can be measured with sub-10-nm precision (Minami et al., Science Adv 2025). Right: Super-resolution chromatin image by structured illumination microscopy (SIM), showing that euchromatin forms condensed domains (Iida, Shimazoe et al., bioRxiv2025).
Single-nucleosome movie(50 ms/frame): Each dot represents a single nucleosome, fluctuating in
place (Iida et al., Science Adv 2022).
Research Topics
We aim to clarify, in living cells, the nature of chromatin domains—especially
their physical properties—and to understand how chromatin domains contribute
to genome functions such as DNA replication, DNA repair, and transcription.
Ongoing projects include: 1. Building a new super-resolution microscopy
systemWe are building a new imaging platform that combines structured illumination
microscopy (SIM), which visualizes chromatin domains in living cells, with
single-molecule microscopy, which tracks the motion of individual molecules
(Fig. 2). Using this system, we observe the structures of chromatin domains
in living human cells and the behavior of nucleosomes and other protein
molecules inside and outside domains (Fig. 3)(Shimazoe et al., bioRxiv 2025).
1. Building a new super-resolution microscopy system
We are building a new imaging platform that combines structured illumination
microscopy (SIM), which visualizes chromatin domains in living cells, with
single-molecule microscopy, which tracks the motion of individual molecules
(Fig. 2). Using this system, we observe the structures of chromatin domains
in living human cells and the behavior of nucleosomes and other protein
molecules inside and outside domains (Fig. 3)(Shimazoe et al., bioRxiv 2025).
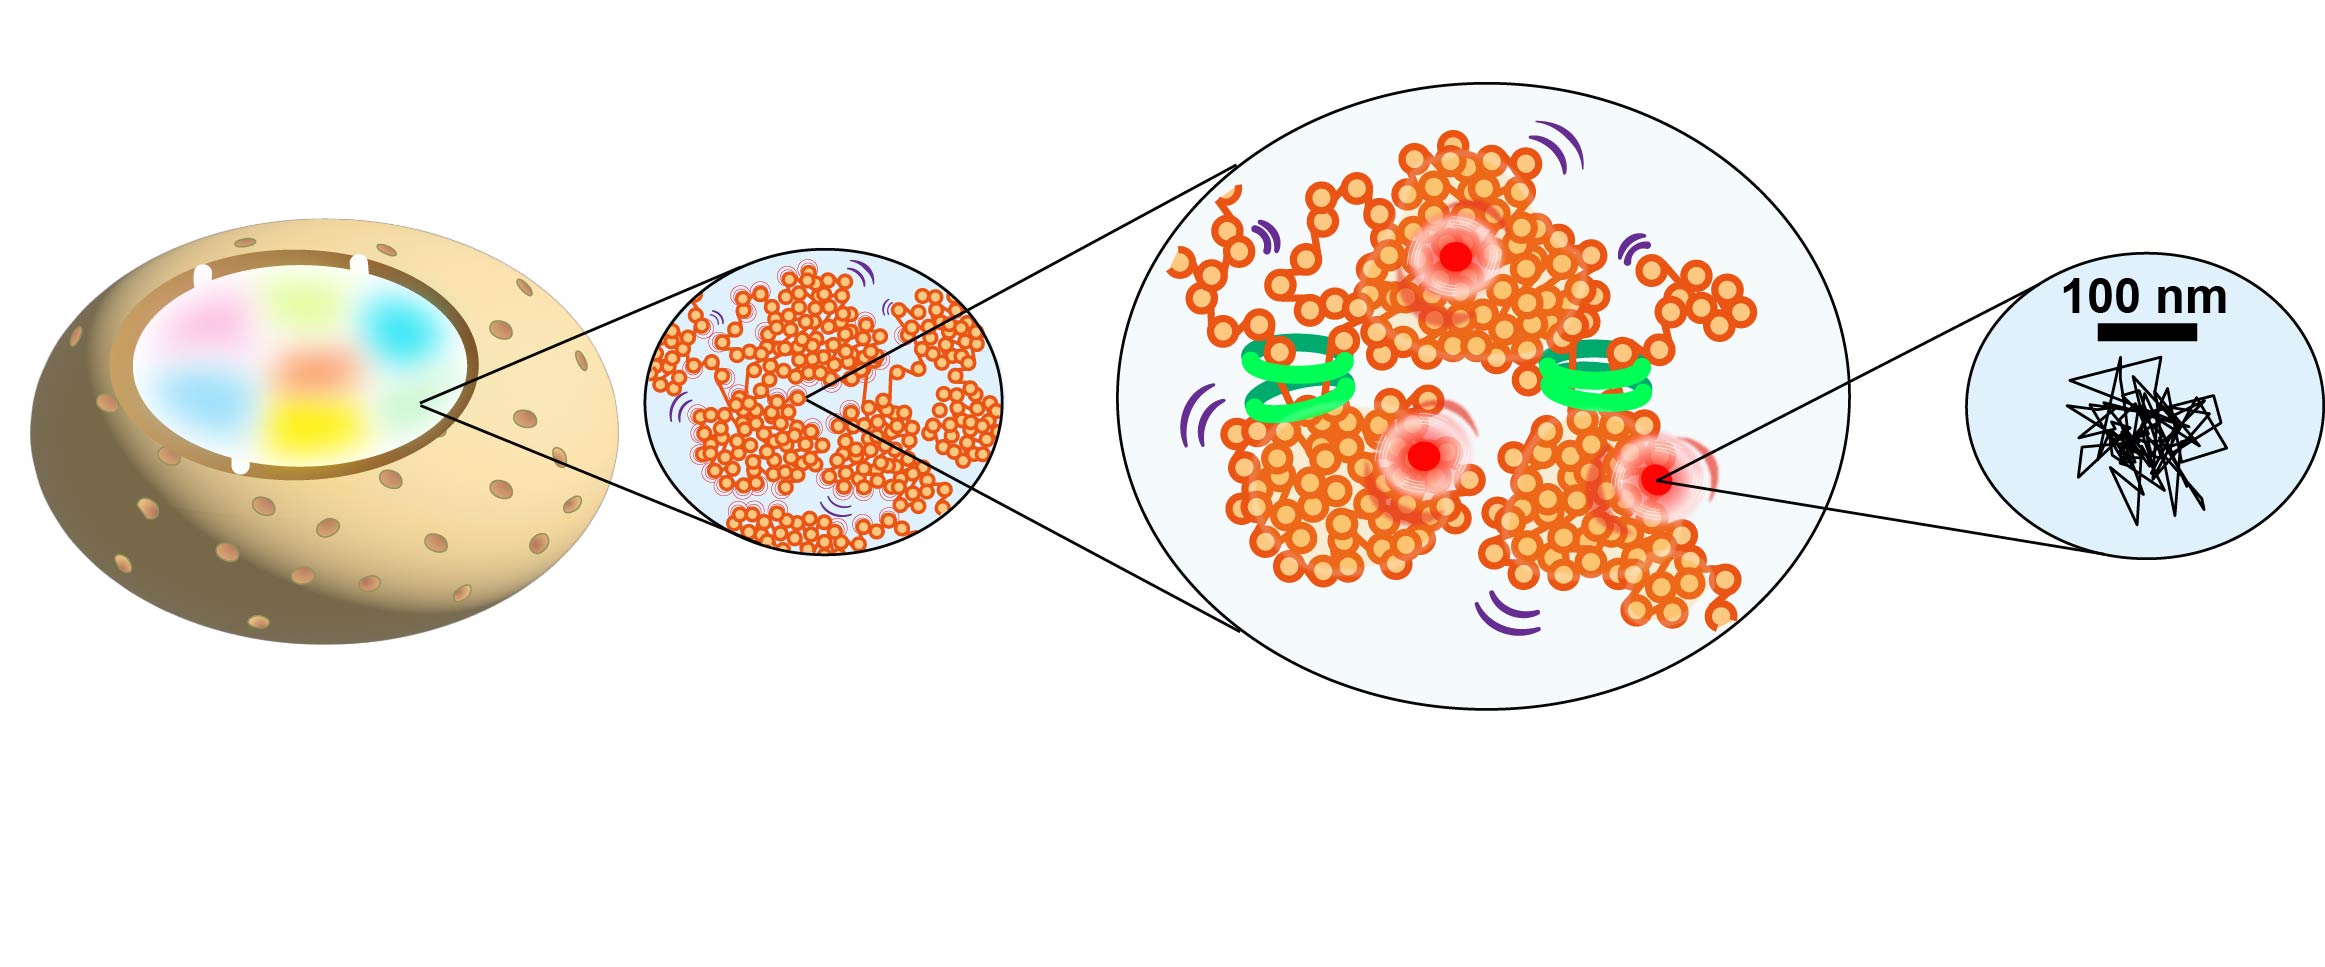
Figure 3.We visualize the structures of euchromatin and heterochromatin domains in living cells and track the motion of nucleosomes and other proteins using the new microscopy system. We then analyze trajectories of nucleosomes and proteins (right).
2. Developing specific labeling methods for euchromatin and heterochromatin
Chromatin consists of transcriptionally active euchromatin and transcriptionally
inactive heterochromatin. While biochemical differences such as histone
modifications are well studied, physical differences between euchromatin
and heterochromatin in living cells remain poorly understood. To address
this, we developed replication-dependent histone labeling (Repli-Histo
labeling), a method to fluorescently label euchromatin and heterochromatin
specifically in living cells (Fig. 4)(Minami et al., Science Adv 2025).Using SIM and single-molecule microscopy (Fig. 2), we aim to quantify
the trajectories of nucleosomes and proteins inside and outside euchromatin
and heterochromatin domains (Fig. 3). We analyze the physical properties
of each domain and how proteins access DNA within domains. We further combine
experiments and computational modeling to clarify the nature of chromatin
domains and the mechanisms of domain formation.
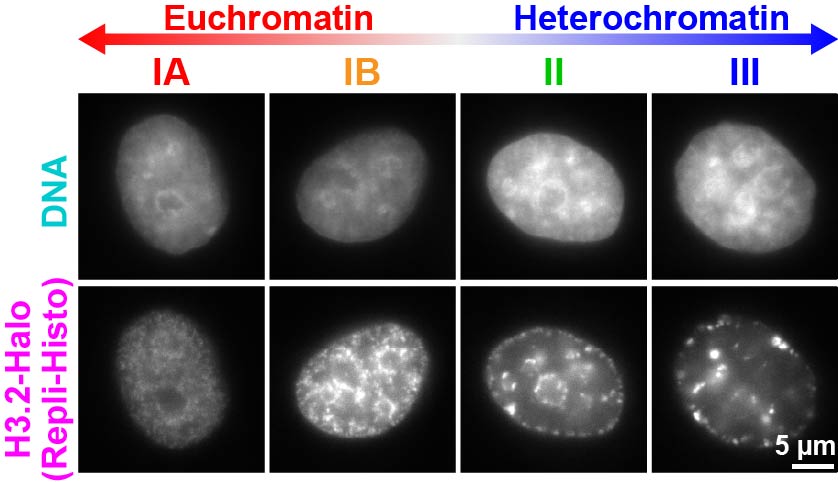
Figure 4.Repli-Histo labeling enables specific labeling of euchromatin and heterochromatin. Upper: DNA staining by DAPI. Lower: Repli-Histo labeling. Chromatin can be labeled in four classes—IA and IB (euchromatin) and II and III (heterochromatin)(Minami et al., Science Adv 2025).
We aim to understand genome functions such as transcriptional regulation from the viewpoint of the physical properties of chromatin domains. Using normal cells, various cancer cells, senescent cells, and disease models, we investigate how changes in the physical properties of chromatin domains relate to cellular dysfunction and differentiation.
References:
1. Maeshima K. (2025) The shifting paradigm of chromatin structure: from
the 30-nm chromatin fiber to liquid-like organization. Proc Jpn Acad Ser B Phys Biol Sci101:339–356. doi:10.2183/pjab.101.020.
2. Maeshima K, Ide S, Babokhov M. (2019) Dynamic chromatin organization
without the 30-nm fiber. Curr Opin Cell Biol 58:95–104. doi:10.1016/j.ceb.2019.02.003.
3. Iida S, Shinkai S, Itoh Y, Tamura S, Kanemaki MT, Onami S, Maeshima
K. (2022) Single-nucleosome imaging reveals steady-state motion of interphase
chromatin in living human cells. Science Adv8: eabn5626. doi:10.1126/sciadv.abn5626.
4. Nozaki T, Imai R, Tanbo M, Nagashima R, Tamura S, Tani T, Joti Y, Tomita
M, Hibino K, Kanemaki MT, Wendt KS, Okada Y, Nagai T, Maeshima K. (2017)
Dynamic organization of chromatin domains revealed by super-resolution
live-cell imaging. Mol Cell 67: 282–293.e7. doi:10.1016/j.molcel.2017.06.018.
5. Nozaki T, Shinkai S, Ide S, Higashi K, Tamura S, Shimazoe MA, Nakagawa
M, Suzuki Y, Okada Y, Sasai M, Onami S, Kurokawa K, Iida S, Maeshima K.
(2023) Condensed but liquid-like domain organization of active chromatin
regions in living human cells. Science Adv9: eadf1488. doi:10.1126/sciadv.adf1488.
6. Iida, S., Shimazoe, M.A., Minami, K., Tamura, S., Ashwin, S.S., Higashi,
K., Nishiyama, T., Kanemaki, M.T., Sasai, M., Schermelleh, L., Toyoda,
A., Kurokawa, K., Maeshima, K. (2025) Cohesin prevents local mixing of
condensed euchromatic domains in living human cells. bioRxiv. doi:10.1101/2025.08.27.672592.
7. Hihara S, Pack CG, Kaizu K, Tani T, Hanafusa T, Nozaki T, Takemoto S,
Yoshimi T, Yokota H, Imamoto N, Sako Y, Kinjo M, Takahashi K, Nagai T,
Maeshima K. (2012) Local nucleosome dynamics facilitate chromatin accessibility
in living mammalian cells. Cell Rep 2:1645–1656. doi:10.1016/j.celrep.2012.11.008.
8. Minami K, Nakazato K, Ide S, Kaizu K, Higashi K, Tamura S, Toyoda A,
Takahashi K, Kurokawa K, Maeshima K. (2025) Replication-dependent histone
labeling dissects the physical properties of euchromatin/heterochromatin
in living human cells. Science Adv 11: eadu8400. doi:10.1126/sciadv.adu8400.
9. Shimazoe MA, Huertas J, Phillips C, Ide S, Tamura S, Farr S, Ashwin
SS, Sasai M, Collepardo-Guevara R, Maeshima K. (2025) Linker histone H1
functions as a liquid-like glue to organize chromatin in living human cells.
bioRxiv. doi:10.1101/2025.03.05.641622.
10. Otsuka A, Shimazo MA, Watanabe S, Minami K, Tamura S, Kiyono T, Takeshita
F, Maeshima K. (2026) Cell Structure and Function. doi:10.1247/csf.25147
▲Page top